Overview of CRISP2D for Windows
CRISP2D CRISP2D for Windows comprises Pre- and Post-Processing Graphical User Interfaces (GUIs), the finite element analysis program and a dedicated spreadsheet utility for printing data. The Pre-Processor offers an intuitive, interactive environment in which analyses can be quickly and easily created and viewed. The Post-Processor operates in a similar environment, incorporating interactive data retrieval and results visualization tools. CRISP has been extensively used worldwide by both the research and the industrial communities for many geotechnical problems, including retaining structures, embankments, tunnels and foundations. It has also been used in the analysis of footings, pile foundations, geotextile reinforcement, soil nailing, effect of anisotropy, slope stability, borehole stability and construction sequence studies.
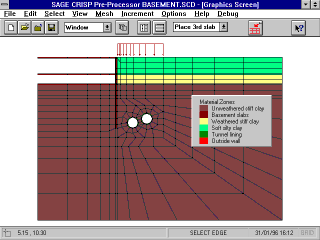
The Pre-Processor Interface: Example Tunnelling Analysis
DEVELOPMENT HISTORY
CRISP (CRItical State soil mechanics Program) is a geotechnical finite element program incorporating critical state soil mechanics theory. It was developed by research workers at Cambridge University Engineering Department from 1975 onwards and was first released publicly in 1982. The program was used mainly in academic circles and on mainframe computers until 1990, when a PC based version (CRISP90) operating under MS DOS was released. This release contained all of the features present in earlier versions, including the ability to model coupled loading and consolidation. In 1995 SAGE Engineering Ltd helped adding a Windows graphical user interface and technical enhancements. Major engineering firms are making increasing use of the program , and at the present time the program is used in hundreds of installations around the world.
THE FINITE ELEMENT PROGRAM
The analysis program is undergoing continual development with work being carried out by research teams around the world. In particular, CRISP is frequently used as a test bed for new constitutive models, which can be bolted onto the existing finite element code. To this end, the source code is available, upon request, to licensees of CRISP. Complete details on the program have been published..
ANALYSIS TYPES
CRISP operates in two dimensional plane strain, or axisymmetry. The finite element program is also capable of analysing three dimensional problems, although in the present version this capability is only available without the use of the GUI. The effective stress Principal is an integral part of the finite element analysis engine. Thus, CRISP can perform drained, undrained and fully coupled (Biot) consolidation analyses.
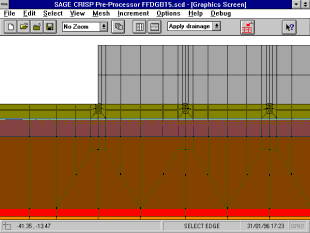
FE Mesh Showing Pressure Fixities
SOIL MODELS
The adequacy of a finite element solution is largely dependant upon the constitutive models used. CRISP2D incorporates a wide range of soil and structural models. These models have been developed over the course of the past 20 years, during which time they have achieved widespread recognition and respect. The soil models include linear elastic, elastic-perfectly plastic and critical state soil models, as listed below:
Linear Elastic:
- Homogeneous, anisotropic
- Non homogeneous, anisotropic
Elastic-Perfectly Plastic:
- Von-Mises
- Tresca Drucker-Prager
- Mohr Coulomb (associated flow rule)
Critical State:
- Cam clay
- Modified Cam clay
- Schofield model
FINITE ELEMENT TYPES
The accuracy of a finite element solution is directly related to the type of finite element used. CRISP provides sufficient element types to give accurate solutions to most geotechnical problems. One, two and three dimensional elements are available along with an interface element for soil structure interaction analysis.
1D Elements:
(for plane strain analysis)
- 2 node bar (4 d.o.f.)
- 3 node bar (6 d.o.f.)
- 2 node beam (6 d.o.f.)
- 3 node beam (9 d.o.f.)
2D Elements:
(for plane strain and axisymmetry)
- 6 node linear strain triangle
- 8 node linear strain quadrilateral
- 15 node cubic strain triangle
- 22 node cubic strain triangle
3D Elements:
(only available without the GUI, i.e. for DOS based analysis only)
- 20 node linear strain brick
- 10 node tetrahedral element
- 2 and 3 noded bars and beams with full translation and rotational degrees of freedom
- Interface element in 3D space
Interface Elements:
FE Mesh Showing Pore Pressure Fixities
THE PRE-PROCESSOR INTERFACE
The Pre-Processor GUI includes the following features:
- An easy-to-use, CAD-style, graphical input window that allows you to create and alter meshes quickly and efficiently
- Point-and-click selection
- Two powerful automatic mesh generators
- Data entry via dialogue boxes, accessed from menus
- Semi-automatic calculation of in situ stresses
- Real-time display of construction sequences
- Graphical display of loads and fixities
- Complete control of all display options
- Full set of Zoom functions
- A material properties checking facility that can be set up with custom property values
- What-You-See-Is-What-You-Get printing of graphics
- A formattable spreadsheet to enable the production of high quality printed output
CREATING A FINITE ELEMENT MESH
Finite elements can be drawn directly onto the Graphics Screen using a combination of keyboard entry and mouse clicks. Small, regular, meshes with relatively few finite elements can be quickly and easily created in this way using the snap-to-grid feature. If, however, you require complex, highly variable mesh with localised regions of very fine elements embedded in a rather coarser mesh, or if you wish to create large numbers of elements, there is a powerful and highly efficient alternative - the Automatic Mesh Generator.
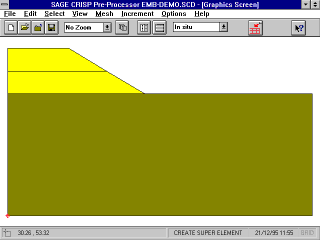
Super Mesh, Showing Clay and Sand Soil Zones
Automated Mesh Generation
The Mesh Generator allows you to automatically create any number of finite elements from a very basic Super Mesh comprising just a few large (super) elements. These large elements can then be automatically sub-divided up into finite elements, allowing you to create finite element meshes of any size or complexity with minimal effort.
Two different mesh generation techniques are available: Unstructured Generation An unstructured super mesh is a freeform mesh of super elements inside which finite elements are generated according to a specified pattern of gradings.
Structured Generation
A structured super mesh is a mesh of quadrilateral super elements, inside which, finite elements are generated according to the number and position of division markers along super element edges.
Finite Element Mesh Created by the UnstructuredMesh Generator
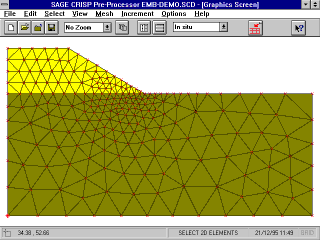
Displacement Fixities
Displacement fixities (either zero, or of a finite prescribed amount) can be assigned to nodes and to the edges of elements in the mesh. Both linear displacement and rotation fixities can be applied:
- x direction
- y direction
- Rotations (in the x-y plane)
PORE PRESSURE FIXITIES
Pore pressure fixities can also be applied to nodes and to element edges. These can take the form of drainage against either a static pressure head, or free draining to atmospheric pressure. Additionally, either excess or total pore water pressure can be set. All fixities can be displayed as icons attached to the relevant nodes and/or edges.
LOADS
Normal, shear and point loads can be applied to nodes and to element edges. Loads can be displayed as arrows offset a small distance from the nodes or edges to which they are attached.
PARAMETRIC ANALYSIS
- Parametric studies can be run to investigate the sensitivity of an analysis to variations in input data. Parametric studies can be carried out on the following parameters (amongst others):
- Material properties
- Applied loads
- Drainage conditions
- Displacement fixities
- Construction sequences
- Time increment
- Numerical dependence
CRISP can carry out parametric studies between analyses that share the same basic mesh geometry. This means that output data from each of the separate analyses is drawn from sampling points in the same geometric positions, thus allowing direct comparisons between output data to be made.
THE POST-PROCESSOR INTERFACE
The CRISP2D Post-Processor is an advanced data visualisation and interpretation package. Global output visualisation tools (contour plots and deformation plots) together with point-and-click selection allows you to quickly home in on regions of most interest. Output can be drawn directly from these points and visualised using the graphing tools provided. It is also possible to compare output data from across several separate analyses, using the Parametric Analysis facility.
The Post Processor GUI is based onthe same graphical display window as is used in the Pre-Processor. Therefore much of the functionality is similar to the Pre-Processor - zoom functions, customisable display options, real-time display of the analysis, point-and-click selection, etc.
The Post-Processor additionally incorporates the following:
- A comprehensive set of graphing tools
- A selective contouring facility
- Displaced mesh plots
- Yield status plots
- Principal stress and strain plots
- Automatic Legend for all plots
- Formatted, tabular printing of output data
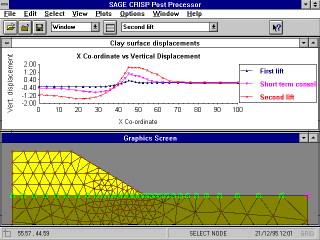
Surface Displacement Graph, Displayed with the
Graphics Screen
Output from the analysis program includes displacements, effective stresses, strains, pore pressures and soil model specific parameters (e.g. mean normal stress for elastic-plastic models, voids ratio for critical state models) form the basic output data. A further forty derived quantities are available, making a total of forty-six output variables.
THE GRAPHING MODULE
The graphing module operates in two slightly different ways. The first method allows you to draw data from a set of sampling points in order to investigate spatial variation of output across the mesh (for example, to study surface movements, as shown in the figure below). The second method allows you to draw data from individual sampling points in order to track the evolution of particular variables through the course of the analysis (for example, stress path plots- the six standard Cam clay stress path plots are available via short-cut buttons).
Up to ten graphs may be open simultaneously, along with the Graphics Screen. Furthermore, data for any graph can be drawn from entirely separate analyses, provided the Parametric Analysis facility was used to create them.
Fully customised graphs can be produced, with legends, a variety of line and symbol styles and full control of fonts. All numerical quantities are displayed in an easily varied format.
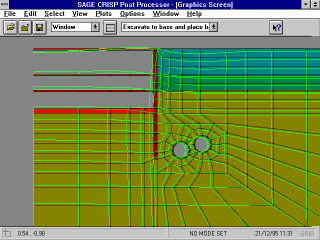
Displaced Mesh Plot, Magnified 50 Times
All graphs can be printed directly, exported as ASCII files for import into other applications or stored as picture files for insertion into documents.
Displacement Plots
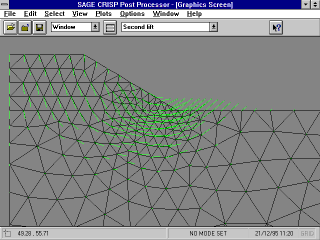
Displacement plots consist of vertical and horizontal nodal displacement data that can be drawn from any stage of the analysis. Magnification factors can be applied to these quantities, should you wish to exaggerate them. Either Vector or Deformed Mesh plots can be produced.
CONTOUR PLOTS
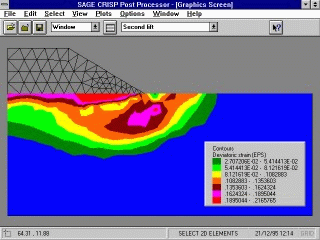
Contours may be plotted for any selection of elements. Four default colour schemes are provided along with a fully customisable, user-defined colour set. Any of the forty-six output quantities may be contoured, at any stage of the analysis.
BENDING MOMENT PLOTS
Bending Moment plots can be drawn for selected beam elements and for 2D elements.
STATUS PLOTS
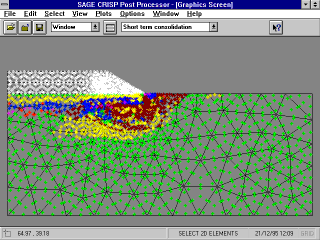
Status plots are global plots that draw data from every point in the mesh and give some form of visual prompt as to what is happening at that point. The data is drawn from any chosen stage of the analysis.
The following Status plots are available:
- Stress State (yield status) Codes
- Principal Strain Directions
- Principal Stress Directions
- Zero Line Extension (for dilatancy studies)
Vector Displacement Plot, Magnified 50 Times
PRINTING
Printed copy of all input and output data is available from within both the Pre- and Post-Processors via the Report Generator.
Graphs can be printed directly, or they can be exported as graphics files. A graphs raw data can be saved in tab-delimited file format for import into other applications.
The graphical display window can also be printed directly, in What-You-See-Is-What-You-Get (WYSIWYG) mode along with a formattable legend. Full support is provided for clipboard cut-and-paste operations.
REPORT GENERATOR
This is a spreadsheet-style environment inside which formatting can be applied to raw data, enabling high quality printed output to be produced.
Contours of Deviatoric Strain
Text styles and layout can be modified and graphics, headers and footers can be added to the spreadsheet. Standard formats can be saved as templates which can then be applied to any set of raw data to instantly create a fully formatted report. Additionally, the data used to draw any graph in the Post-Processor can be sent directly to the Report Generator for printing.
ON-LINE HELP
In-depth context sensitive help is available throughout the interface. Error message help is also available, giving advice and describing the origins of certain error and warning messages output by the analysis program.
EXISTING PUBLICATIONS
Every copy of the program sold is accompanied by a Publications Directory. This contains reproductions of papers that have been published over the past 10 years whose content was derived through use of the CRISP analysis program. This is the most complete compilation of its kind and provides an comprehensive source of up-to-date reference describing the application of CRISP to a wide range of problems
Status Plot Showing Cam Clay Stress State Codes
.
SYSTEM REQUIREMENTS
A Pentium PC or equivalent
SUPPORT SERVICES
After the initial ninety days of free technical support, we are happy to provide technical support for the interface for a yearly subscription fee.
FEATURE SUMMARY of CRISP2D
- 2D Plane Strain
- Real-Time Display of Construction Sequences
- 2D Axisymmetry
- Graphical Display of Loads and Fixities
- Drained Analysis
- Fully Customisable Display Options
- Undrained Analysis
- Automatic Calculation of In Situ Stresses
- Fully Coupled Consolidation Analysis
- Comprehensive Graphing Module
- Triangular and Quadrilateral Finite Elements
- Deformed Mesh Plots
- Structural Bar and Beam Elements
- Contour Plots
- Interface Element
- Yield Status Plots
- Automatic Unstructured Mesh Generation
- Principal Stress and Strain Plots
- Automatic Structured Mesh Generation
- Automatic Legend
- CAD-Style Mesh Creation
- Formattable Spreadsheet-Style Printed Output
- Point-and-Click Selection
| 


