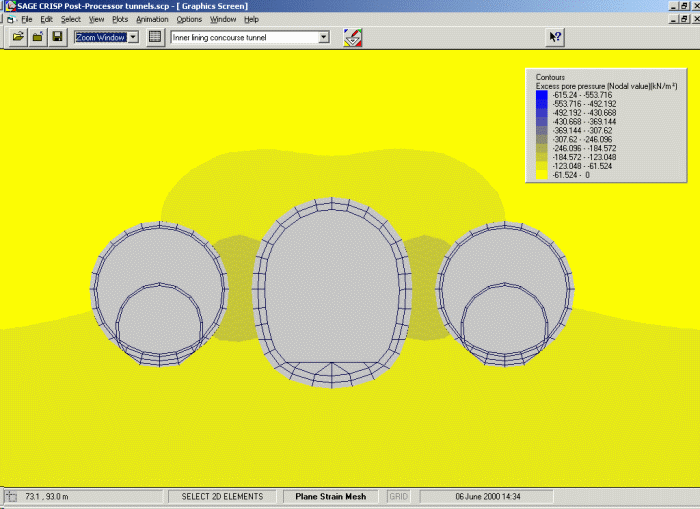
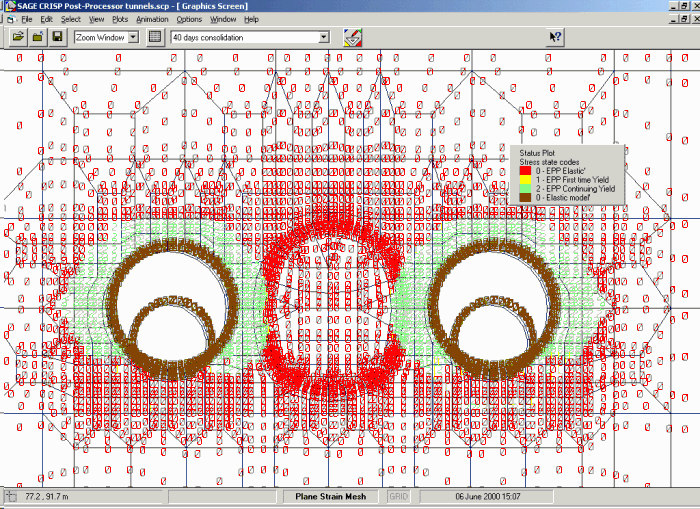
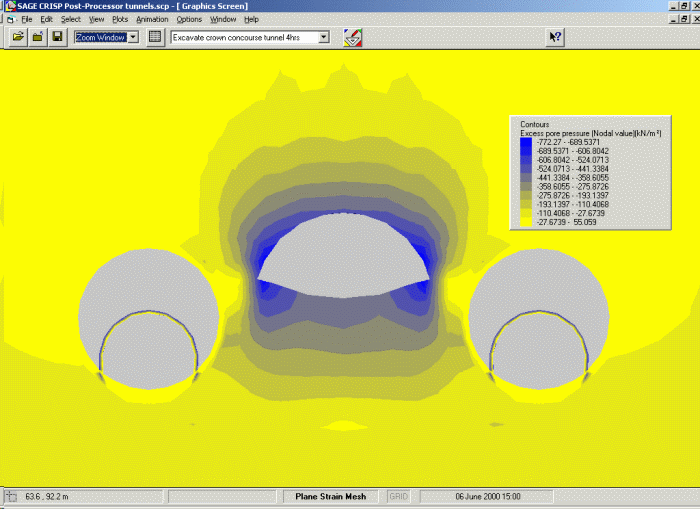
The following images show deformation profile, excess pore pressure distribution and stress state code.
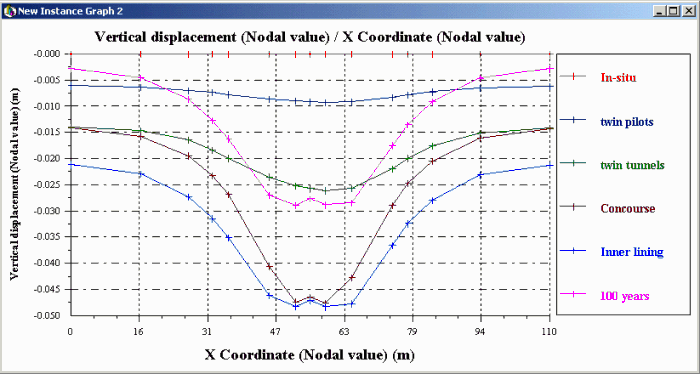
Graph showing surface settlement at different stages of construction
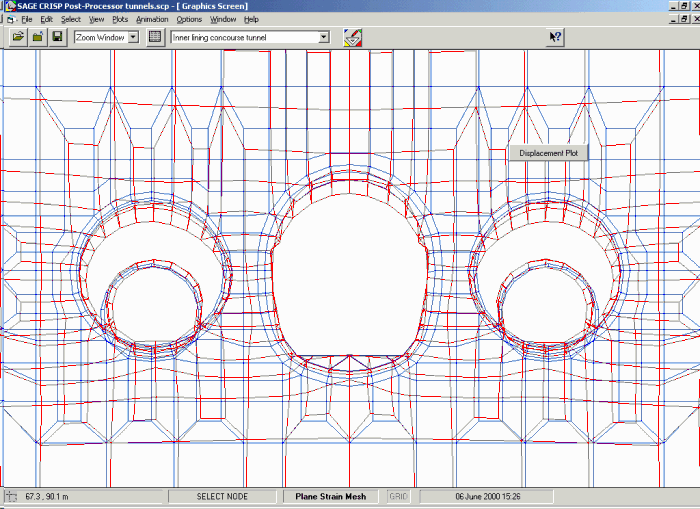
Plot of deformed mesh at the end of tunnels construction. Deformation magnified 20 times
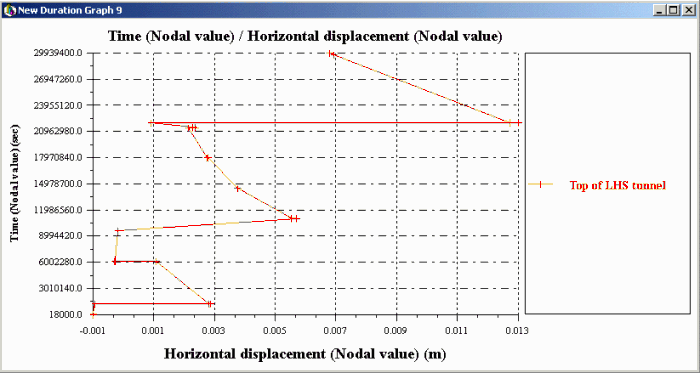
Graph of horizontal displacement of a point above left hand side tunnel up to the end of construction. The sudden increase two third of the way up the graph corresponds to the excavation of the central concourse cavern. The build up in negative pore pressure causes an inward movement. Subsequent consolidation causes an outward movement as can be seen in the last section of the graph
Plot of stress state code at the end of the excavation of the two tunnels
Excess pore pressure distribution at the stage of excavation of crown of concourse
Excess pore pressure distribution at the end of construction
